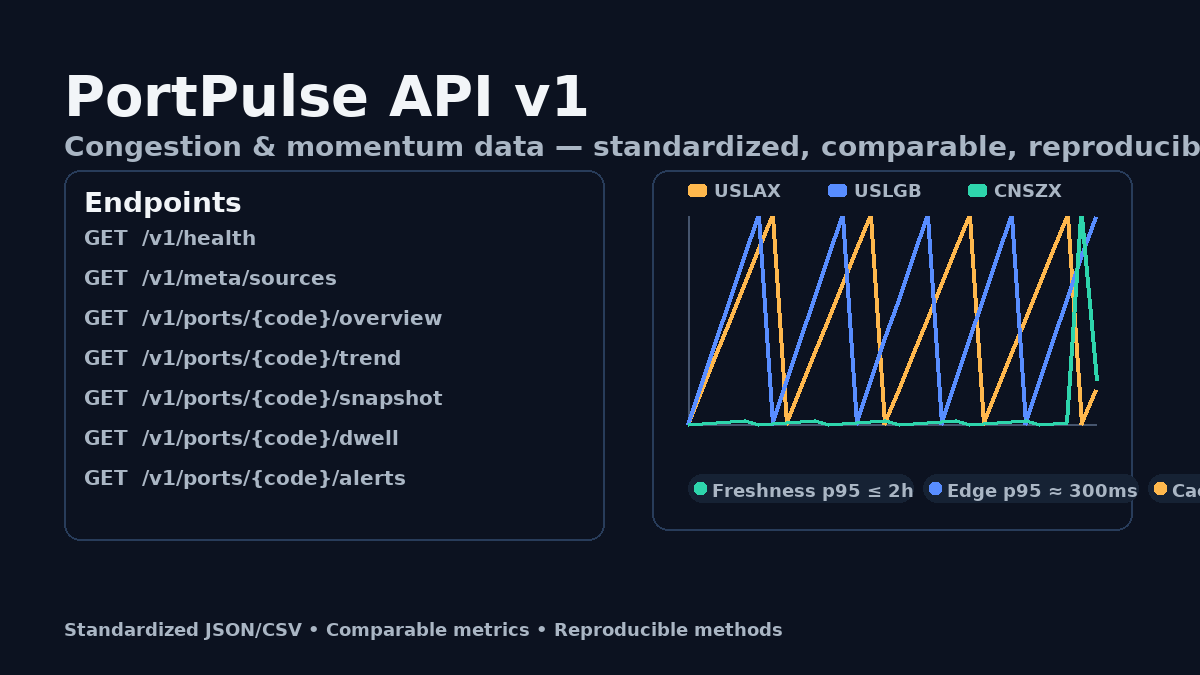
PortPulse congestion & momentum data — API-first, comparable, and production ready
We are making port-level congestion and trade momentum data generally available via API. The release focuses on comparability across ports, transparent SLOs, and reproducible methods so teams can move from ad-hoc dashboards to production automation in days, not months.

Why this matters, now
Global planners have never had a simple, auditable way to compare congestion and dwell across gateways. Most teams still rely on screenshots, bespoke scrapers, or vendor dashboards that are hard to integrate. PortPulse takes a different path: an API-first data service that exposes the same standardized metrics in JSON and CSV, backed by freshness SLOs and a 30-day replay window.
What we are releasing
Core endpoints under /v1 cover health, metadata, snapshot, trend, dwell, and alerts. Read endpoints ship with strong caching (CSV + ETag/304), consistent error bodies, and x-request-id for traceability. p95 latency < 300 ms at the edge with a 60%+ cache-hit target. Freshness SLO is p95 ≤ 2h with explicit timing fields for audit.

Who uses this
- Operators & supply teams: lane buffers, cut-off decisions for critical SKUs.
- Forwarders: dwell-based exceptions to portals; Slack/webhook alerts on thresholds.
- Funds/macro: standardized time series for indicators without apples-to-oranges.
- Data teams: replace fragile scrapers with a versioned, documented contract.
Defining “comparable congestion”
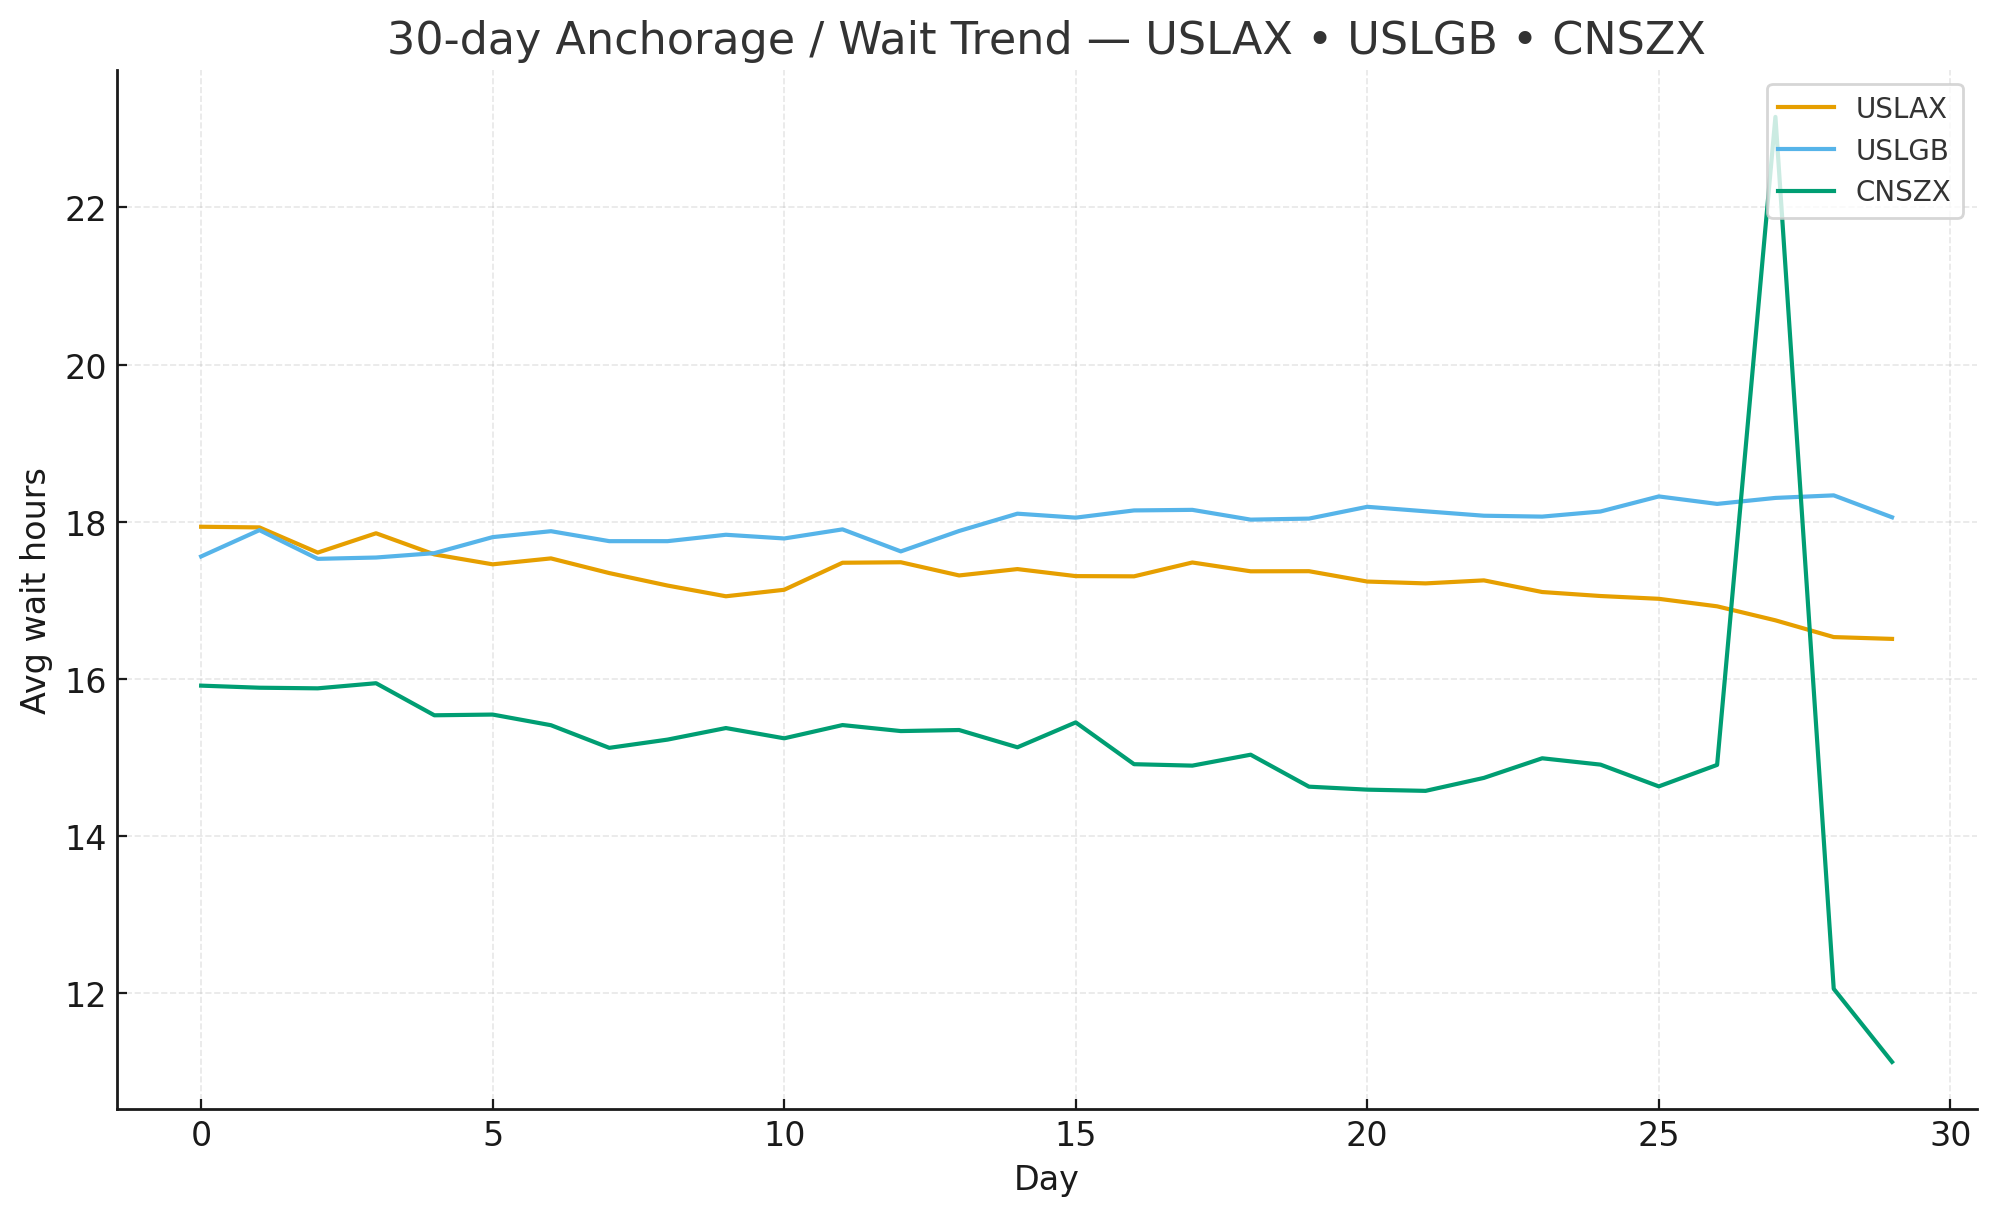
- avg_wait_hours — robust proxy for waiting time (events + schedules + movement).
- queue_length — estimated queue size that pairs with avg_wait_hours.
- berth_efficiency — normalized throughput proxy.
- congestion_score — standardized per-port z-score → a 0–1 index, apples-to-apples.
A pragmatic data pipeline
Multi-source ingest → harmonized events model → clipping at extremes → light smoothing → same-day latest wins → hourly ETL with retries and next-day backfill. A clean daily table you can trust.
Contract-first API design
We freeze /v1; breaking changes go to v1beta with ≥90d deprecation. Unified error body {code,message,request_id,hint}. CSV emits strong ETags for conditional GETs and safe HEAD checks.
Endpoints at a glance
- GET /v1/health
- GET /v1/meta/sources
- GET /v1/ports/{UNLOCODE}/overview | trend | snapshot | dwell | alerts
- GET /v1/hs/{code}/imports (beta)
Coverage & expansion
We prioritize three corridors (APAC→NA, APAC→EU, TA). 100+ ports in scope; on-request additions onboard in 2–4 weeks under the same schema & SLO.
Freshness & replay
Freshness p95 ≤ 2h; last_updated/as_of exposed. 30-day replay for audit/backtest. CSV + ETag/304 keeps pull jobs cheap and fast.
Patterns we see working
1) Lane buffers with rules: raise buffer when congestion_score > 0.65 for 5+ consecutive days.
2) Booking exceptions: push Slack alert if queue_length jumps 2σ in a week.
3) BI apples-to-apples: combine absolute hours with normalized scores in a single view.
Security & governance
Key prefixes per env, scoped by default, easy rotation; request_id in logs; GDPR/CCPA friendly; optional IP allow lists at the edge.
Roadmap with stability
Near term: freshness dashboard; smarter /alerts (change-points); Port Packs & Hi-Confidence add-ons. All without breaking /v1.
Trial & pricing
14-day evaluation for up to five ports. Lite/Starter/Pro tiers; Port Packs and Alerts add-ons. Keys provision automatically with cURL examples.
Closing note
If you need a reliable way to embed port congestion and momentum into planning or customer apps, start with five ports and point BI/code at /v1. Standardized fields plus honest methods unlock automation fast.